Excel is a powerful tool that can revolutionize the way you manage and analyze data. Whether you're a student, a professional, or just someone who wants to stay organized, learning Excel can be incredibly beneficial. In this comprehensive guide, we will take you through the basics and advanced features of Excel, helping you unlock its full potential.
Getting Started with Excel

If you're new to Excel, it's important to familiarize yourself with the interface and basic navigation. Here's a quick overview:
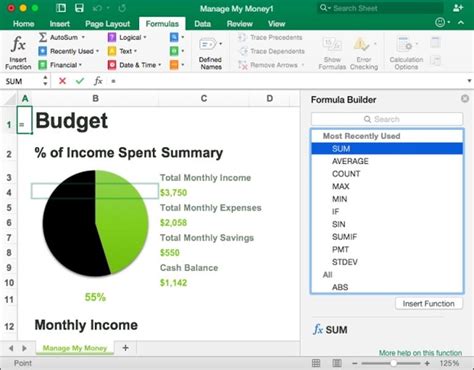
- Ribbon: The ribbon is located at the top of the Excel window and contains various tabs, such as Home, Insert, and Formulas. Each tab has its own set of tools and commands.
- Worksheets: An Excel file is made up of multiple worksheets, which are like individual pages. You can switch between worksheets using the tabs at the bottom of the window.
- Cells: Excel is organized into a grid of cells, with rows identified by numbers and columns by letters. Each cell has a unique address, such as
A1,B5, etc. - Formulas and Functions: Excel's strength lies in its ability to perform calculations. You can use formulas (e.g.,
=SUM(A1:A5)) and functions (e.g.,SUM,AVERAGE,IF) to manipulate data and generate insights.
Basic Excel Functions

Mastering basic functions is essential for any Excel user. Here are some commonly used functions:
- SUM: Calculates the total of a range of cells.
=SUM(A1:A10)will add the values in cellsA1toA10. - AVERAGE: Computes the average of a range of cells.
=AVERAGE(B2:B20)will give you the average of the values in cellsB2toB20. - MAX and MIN: These functions find the highest and lowest values in a range, respectively.
=MAX(C3:C15)will return the maximum value in cellsC3toC15. - COUNT: Counts the number of cells in a range that contain numbers.
=COUNT(D4:D25)will count the numeric values in cellsD4toD25.
You can combine these functions to create more complex formulas. For example, =SUM(A1:A10)/COUNT(A1:A10) will calculate the average of the values in cells A1 to A10.
Formatting and Presentation

Excel allows you to format your data to make it more visually appealing and easier to understand. Here are some formatting options:
- Cell Formatting: You can change the font, size, and color of text, as well as apply number formats (e.g., currency, percentage, date) to cells.
- Conditional Formatting: This feature lets you highlight cells based on specific conditions. For instance, you can color-code cells that contain values above a certain threshold.
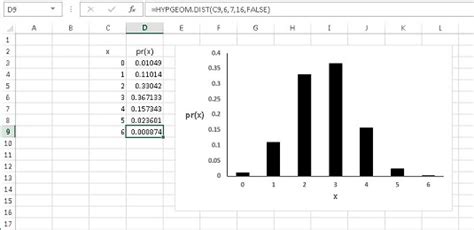
- Charts and Graphs: Excel offers a wide range of chart types to visualize your data. You can create bar charts, line graphs, pie charts, and more to present your data effectively.
Advanced Excel Features

PivotTables
PivotTables are a powerful tool for analyzing large datasets. They allow you to summarize and organize data in a flexible and dynamic way. Here's a step-by-step guide to creating a PivotTable:
- Select the range of cells that contain your data.
- Go to the Insert tab and click on PivotTable.
- In the Create PivotTable dialog box, choose the location for your PivotTable and click OK.
- In the PivotTable Fields pane, drag and drop fields to the appropriate areas (e.g., Rows, Columns, Values).
- Customize your PivotTable by adding filters, sorting, and grouping data.
PivotTables are incredibly versatile and can be used for tasks like summarizing sales data, analyzing survey results, and creating dynamic reports.
Macros and VBA
Macros and Visual Basic for Applications (VBA) allow you to automate repetitive tasks and create custom functions. VBA is a programming language embedded in Excel that lets you write code to extend Excel's capabilities.
- Enable the Developer tab in Excel by going to File > Options > Customize Ribbon and checking the Developer box.
- Click on the Developer tab and select Visual Basic to open the VBA editor.
- Write your VBA code in the editor. For example, you can create a simple macro to sum a range of cells:
Sub SumCells()
  Range("D10").Value = Application.Sum(Range("A1:C10"))
End Sub
- Save your code and close the VBA editor.
- Assign the macro to a button or keyboard shortcut for easy access.
Data Analysis and Visualization
Excel offers a range of tools for advanced data analysis and visualization. Some key features include:
- What-If Analysis: This feature allows you to explore different scenarios and see how changes in input values affect the outcome.
- Goal Seek: With Goal Seek, you can find the input value that produces a specific result, making it useful for optimization problems.
- Solver: The Solver add-in helps you find optimal solutions to complex problems with multiple variables and constraints.
- Data Validation: You can set rules to control what data is entered into cells, ensuring data integrity.
Tips and Tricks

- Use keyboard shortcuts to speed up your work. For example, Ctrl + C to copy, Ctrl + V to paste, and Ctrl + Z to undo.
- Name your ranges to make formulas more readable and easier to understand.
- Take advantage of Excel's built-in templates to quickly create professional-looking spreadsheets.
- Use the Find and Replace feature to search for and replace specific values or text in your worksheet.
Conclusion

Excel is a versatile and powerful tool that can enhance your productivity and data analysis capabilities. Whether you're a beginner or an advanced user, there's always more to learn and explore. By mastering Excel, you'll be able to make informed decisions, create dynamic reports, and present your data in a compelling way.
FAQ

How do I insert a new worksheet in Excel?
+To insert a new worksheet, click on the plus icon next to the existing worksheets at the bottom of the Excel window.
Can I create custom charts in Excel?
+Yes, Excel offers a wide range of chart types, and you can customize them by selecting the chart and using the options in the Chart Tools tab.
How do I protect my Excel workbook with a password?
+To protect your workbook, go to File > Info > Protect Workbook and choose Encrypt with Password. Enter a password and confirm it.
What is the difference between a formula and a function in Excel?
+A formula is a custom equation you create, while a function is a pre-defined formula provided by Excel. Functions are often more efficient and easier to use than creating formulas from scratch.